Toxic cyanobacteria blooms can close beaches, threaten drinking water, and harm pets and wildlife. Several treatments can control a bloom, and choosing between them is a real decision.
Jordan Lake, North Carolina, June 2022
Dogs became ill after swimming at Jordan Lake, and at least one died. Chatham County issued a public warning about toxic algae in the water, and told people to keep themselves and their pets out of it.
Treatments are usually compared on how well they control the bloom. This tool adds a comparison of predicted risk to green algae, zooplankton, and fish, to help identify the lowest-risk option.
Each of the three groups is scored because it plays a distinct role in the lake:
Green algae
Primary producers at the base of the food web, and the standard non-target algae in toxicity testing.
Water fleas
Zooplankton that graze algae and feed fish, which makes them part of the lake’s natural check on algae.
Fish
The visible top of the system, and the reason most people care about the lake in the first place.
Most comparisons ask which treatment controls the bloom. This tool also asks which one does it with the lowest predicted risk to everything else.
How it works
Score the trade-off, keep the axes separate, then predict the pairs.
The tool combines two established methods (selectivity indices from toxicology and Bliss independence from combination pharmacology) into one framework for bloom control. Three steps, no black boxes.
1
Score
Selectivity Index = non-target EC50 divided by target EC50
SI = EC50 (bystander) ÷ EC50 (bloom)
EC50 is the dose that causes a 50% effect. It runs backwards from intuition: a low EC50 means harm arrives at a small dose, so a low number is a sensitive organism, not a safe one.
The ideal treatment kills the bloom at a low dose and only touches the bystanders at a much higher dose. That gap is the selectivity window, and SI measures it as a single number.
A favorable treatment (illustrated). The bloom hits 50% effect at a low dose, the bystander only at a much higher one. The wider that gap, the higher the SI.
SI above 1: good
The bloom dies first. There is a dose that controls the bloom before the bystander is meaningfully harmed.
SI below 1: flagged
In the published tests, the bystander responded at a lower dose than the bloom did. The tool flags that axis.
2
Separate
Three non-target axes, tracked independently and never averaged
Green alga
Raphidocelis subcapitata
The primary producer. If it goes, the food web loses its base.
Water flea
Daphnia magna
The grazer. It eats algae and feeds fish, so it sits in the middle of everything.
Fish
Danio rerio
The vertebrate check. Standard proxy for vertebrate safety, including ours.
A treatment can score well for one group and poorly for another. Copper is the clearest case: it looks excellent against the green alga and much weaker against the water flea. Average those two numbers together and you get one comfortable-looking score that hides exactly the trade-off a lake manager needs to see.
So the axes are reported separately, and the headline number is min-SI, the worst axis of the three.
You are only as selective as your weakest link.
3
Combine
Predict what treatment pairs will do, before anyone runs the experiment
effect(A+B) = A + B − (A × B)
This is Bliss independence: the effect of A, plus the effect of B, minus the overlap you would otherwise count twice. It assumes the two agents act independently, which is a stated assumption rather than a claim.
Why it matters here: since the headline score is the weakest axis, the way to improve a treatment is to lift that axis. Pair something strong on the green alga axis with something strong on the water flea axis and the pair can outrank either one alone. The tool generates every single treatment and every pair, scores them on the same scale, and ranks them together.
Bar length is selectivity on that axis (illustrative, not data). The pair gives up some of A's best axis and buys back the axis that was failing, which is what raises its min-SI.
Who it is for
Anyone who has to choose a treatment and then live with the lake afterward.
The output is a ranked table with the reasoning attached, so it can be read, argued with, and reproduced.
Lake managers
Comparing treatment options for a specific waterbody.
Water utilities
Protecting source water while weighing non-target risk.
Watershed nonprofits
Asking informed questions about a proposed treatment plan.
Researchers
Generating testable hypotheses about treatment combinations.
Regulators
Weighing permit decisions against non-target impact.
Results
What the tool predicts for Microcystis
Every treatment and predicted pair scored against Microcystis aeruginosa, ranked by min-SI, the worst of its non-target axes. A score below 1 would be flagged; no current entry falls below 1.
Selectivity ranking of bloom treatments against Microcystis aeruginosa
These are predictions, not measurements. Values are computed from published toxicity data under stated assumptions (Bliss independence, Hill slope of 1, equipotent-on-target mixing) and are awaiting laboratory validation. Combinations are model output and have not been tested. Scored here on the two lab-testable axes for this target.
What shows up once you actually score the trade-off.
None of these are visible when treatments are compared on bloom control alone.
Finding 01
Copper's effective dose rises with bloom density.
Published work (Tsai 2016; Kinley et al. 2017) shows the concentration needed to control Microcystis rises as cell density increases. That narrows copper's margin against Daphnia, which is already its weakest axis in the table above. Copper's score is the one most sensitive to the conditions of a real bloom.
SI 3.4Daphnia axis, at test cell density
Finding 02
The ranking depends on which data you pair.
Our first version paired a short-test average across five cyanobacteria with a longer growth test on a single green alga, and ranked diquat last. Using matched values from one study (Peterson et al. 1997), diquat ranks second. Mismatched test lengths and endpoints can move a treatment from last to near first.
6th to 2nddiquat rank, mismatched vs. matched data
Finding 03
The data to answer this question barely exists.
Compiling published toxicity data across 13 treatments and 4 cyanobacteria genera, only 13 of 52 target-kill cells could be filled. The non-target side of the ledger is comparatively rich, because harm to fish, water fleas, and green algae is what regulatory testing is built to measure. How well a chemical kills the bloom itself is measured far less consistently.
13 of 52target-kill cells filled
Where the numbers come fromThe published values behind each score.
Each selectivity index is a non-target EC50 divided by the Microcystis EC50. A lower EC50 means the organism responds at a lower dose.
Diquat dibromide
Organism
EC50
Source
Microcystis
0.098, 0.105 mg/L
Peterson et al. 1997Carbon-uptake test, about 22 h
Green alga
0.492 mg/L
Peterson et al. 1997Same study and test (value used)
Green alga
0.032 mg/L
EPA ECOTOX72 to 96 h growth (not used)
Green alga
0.13 mg/L
Reward product safety data sheet72 h, as formulated product (not used)
Daphnia
1.86 mg/L
EPA ECOTOX
Fish
50.2 mg/L
EPA ECOTOX
Copper sulfate
Organism
EC50
Source
Microcystis
0.063 mg Cu/L
Tsai 2016Matched 96 h growth
Green alga
1.873 mg Cu/L
Tsai 2016Matched 96 h growth
Daphnia
0.216 mg Cu/L
EPA ECOTOX Knowledgebase
Fish
0.317 mg Cu/L
EPA ECOTOX Knowledgebase
Hydrogen peroxide
Organism
EC50
Source
Microcystis
2.62 mg/L
Weenink et al. 2022
Green alga
27.7 mg/L
Weenink et al. 2022
Daphnia
6.51 mg/L
Weenink et al. 2022
EC50 values differ between studies because of test length, endpoint, strain, and water chemistry. Rankings should be read as comparisons, not predictions for a specific pond.
LimitationsWhat this tool does not tell you.
Read this before using the output. Every item here is a constraint we can state precisely, which is the point: each one is testable, and the planned lab work is designed to test them.
Predictions are not measurements.
Every combination value in the ranking is a hypothesis generated under stated assumptions. None of the combinations has been measured in a lab. Validation is planned, and both agreement and disagreement with the predictions are reportable results.
The input data is sparse.
The published literature contains comparable target-kill values for only a fraction of treatment and organism pairs. The rankings rest on relatively few fully scored treatments, so a single new measurement can move them.
Exposure durations do not always match.
Some published values compare target and non-target toxicity measured over different exposure times and endpoints. Because the target value sits in the denominator of the index, a mismatch inflates apparent selectivity. Affected entries are flagged in the code.
Bliss independence can be violated.
The combination model assumes the two agents act independently. Agents that share a mechanism (copper and hydrogen peroxide both act partly through oxidative stress) may not. Where the lab disagrees with the prediction, that disagreement is the finding.
It ranks by selectivity, not efficacy.
A treatment can kill the target extremely well and still rank poorly here. That is intended behavior, not a bug. This tool answers one question (what is the predicted risk to non-target organisms) and should sit alongside efficacy, cost, and permitting, not replace them.
Water chemistry changes toxicity.
Toxicity varies with water chemistry. Copper in particular is far more toxic in soft, low-alkalinity water than in hard water.
Strains differ.
Microcystis strains respond differently to the same product.
Microcystis is not the only bloom organism.
Other bloom organisms occur in North Carolina (for example Euglena and Prymnesium), and some treatments target green algae blooms instead.
Copper products are not all alike.
Chelated copper products are generally lower risk than copper sulfate. Copper is also toxic to mollusks, which this tool does not score.
Lab water is not lake water.
Lab values measured in clean water can differ substantially from values in natural water.
Try it yourself
Run the ranking in your browser.
The same math as the archived Python tool, running locally on this page, with the corrected diquat values. Change the metric, drop an axis, remove a treatment, and watch the ranking reorder.
Important: This tool is for education and research. It is not a treatment recommendation. Registered products have undergone EPA risk assessment, and the product label governs how they may be used. Consult a licensed aquatic applicator or your state agency before treating any water body.
Rank by
Non-target axes
Fish is off by default because that axis cannot be lab validated here.
Treatments
Removing a treatment also removes every combination containing it.
Which published green-alga value for diquat?
Same treatment, different published study, very different ranking. This is why matched data matters.
Rank
Treatment or combination
min-SI
geo mean
Per-axis SI
Entries are grouped by how many axes they were scored on. A treatment scored on more axes has more chances to hit a low worst axis, so ranks are only comparable inside a group.
Select at least one treatment and one axis to see a ranking.
Scroll the table sideways to see every column.
Ranked by the weakest non-target axis. A treatment is only as selective as its worst link.
Under Bliss independence, each of a combination's scores falls between its two ingredients' scores. When two treatments are weak on different organisms, the combination's weakest score can end up higher than either one alone. With the matched diquat values, copper plus diquat does exactly that. Lab testing would show whether the prediction holds, or whether the pair interacts.
These are predictions from published data, not measurements. The Python implementation archived at the DOI is the citable reference for the method. The diquat values on this page were corrected in September 2026 and differ from the archived release.
Field Visit
Inside the Plant
Our visit to the Cary/Apex Water Treatment Facility
On September 30, 2026, we toured the Cary/Apex Water Treatment Facility, which treats Jordan Lake water for more than 310,000 people in Cary, Apex, Morrisville, and part of Research Triangle Park. The visit changed how we frame our project. Jordan Lake is operated by the US Army Corps of Engineers, and algae is not treated in the lake itself. Instead, the plant manages it on site, adjusting activated carbon to measured taste-and-odor compounds and using ozone and biofiltration. That is why our tool is aimed at ponds and smaller lakes, where in-lake treatment actually happens.
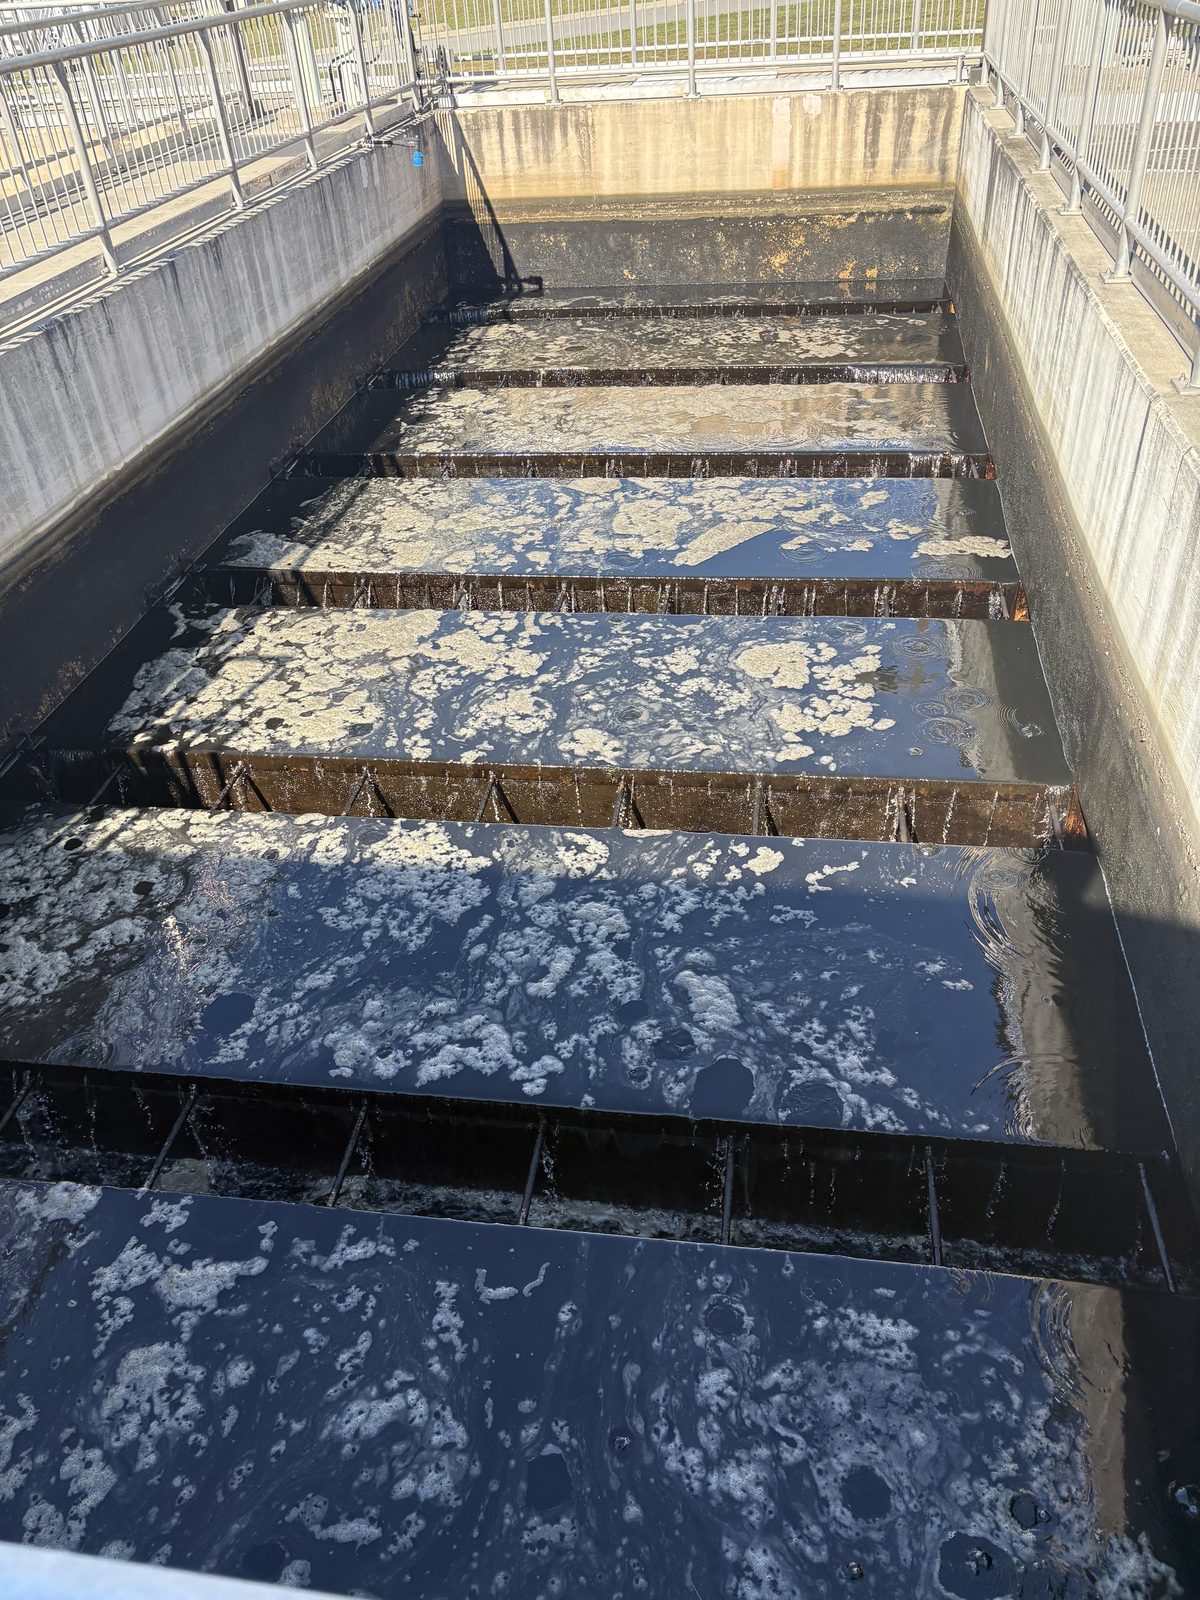
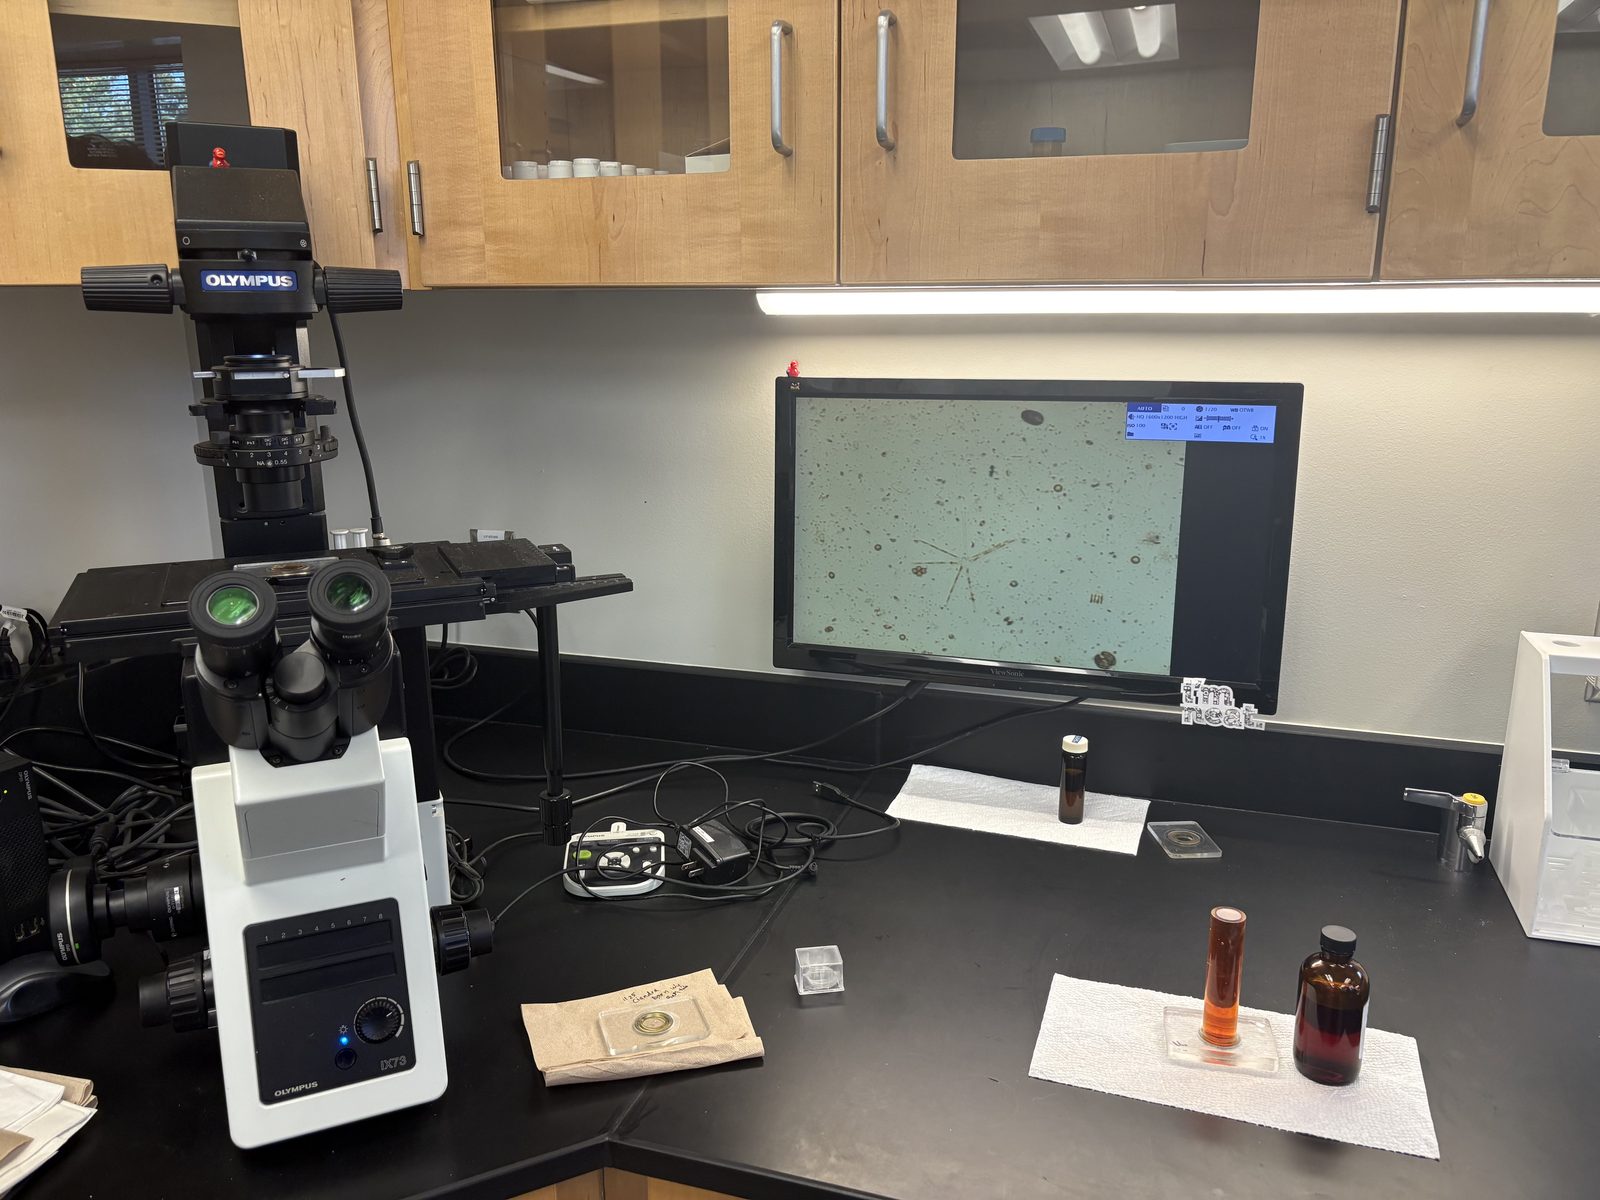
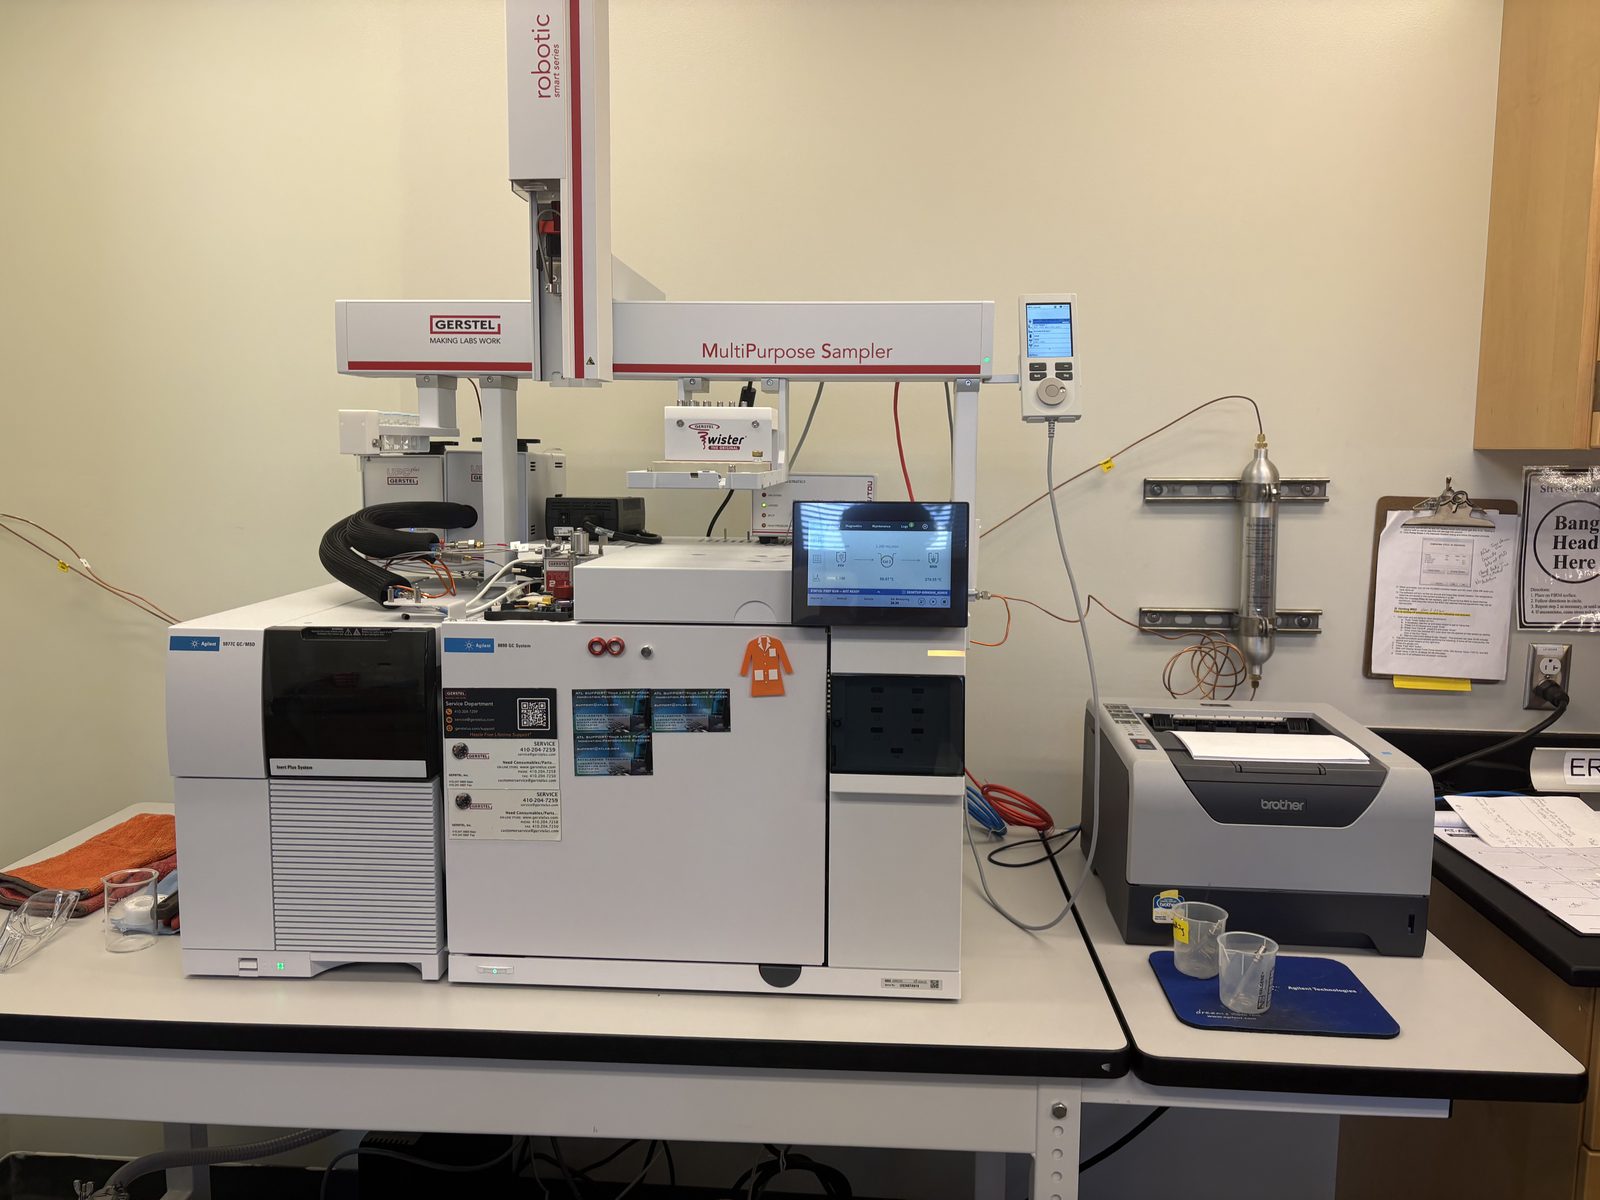
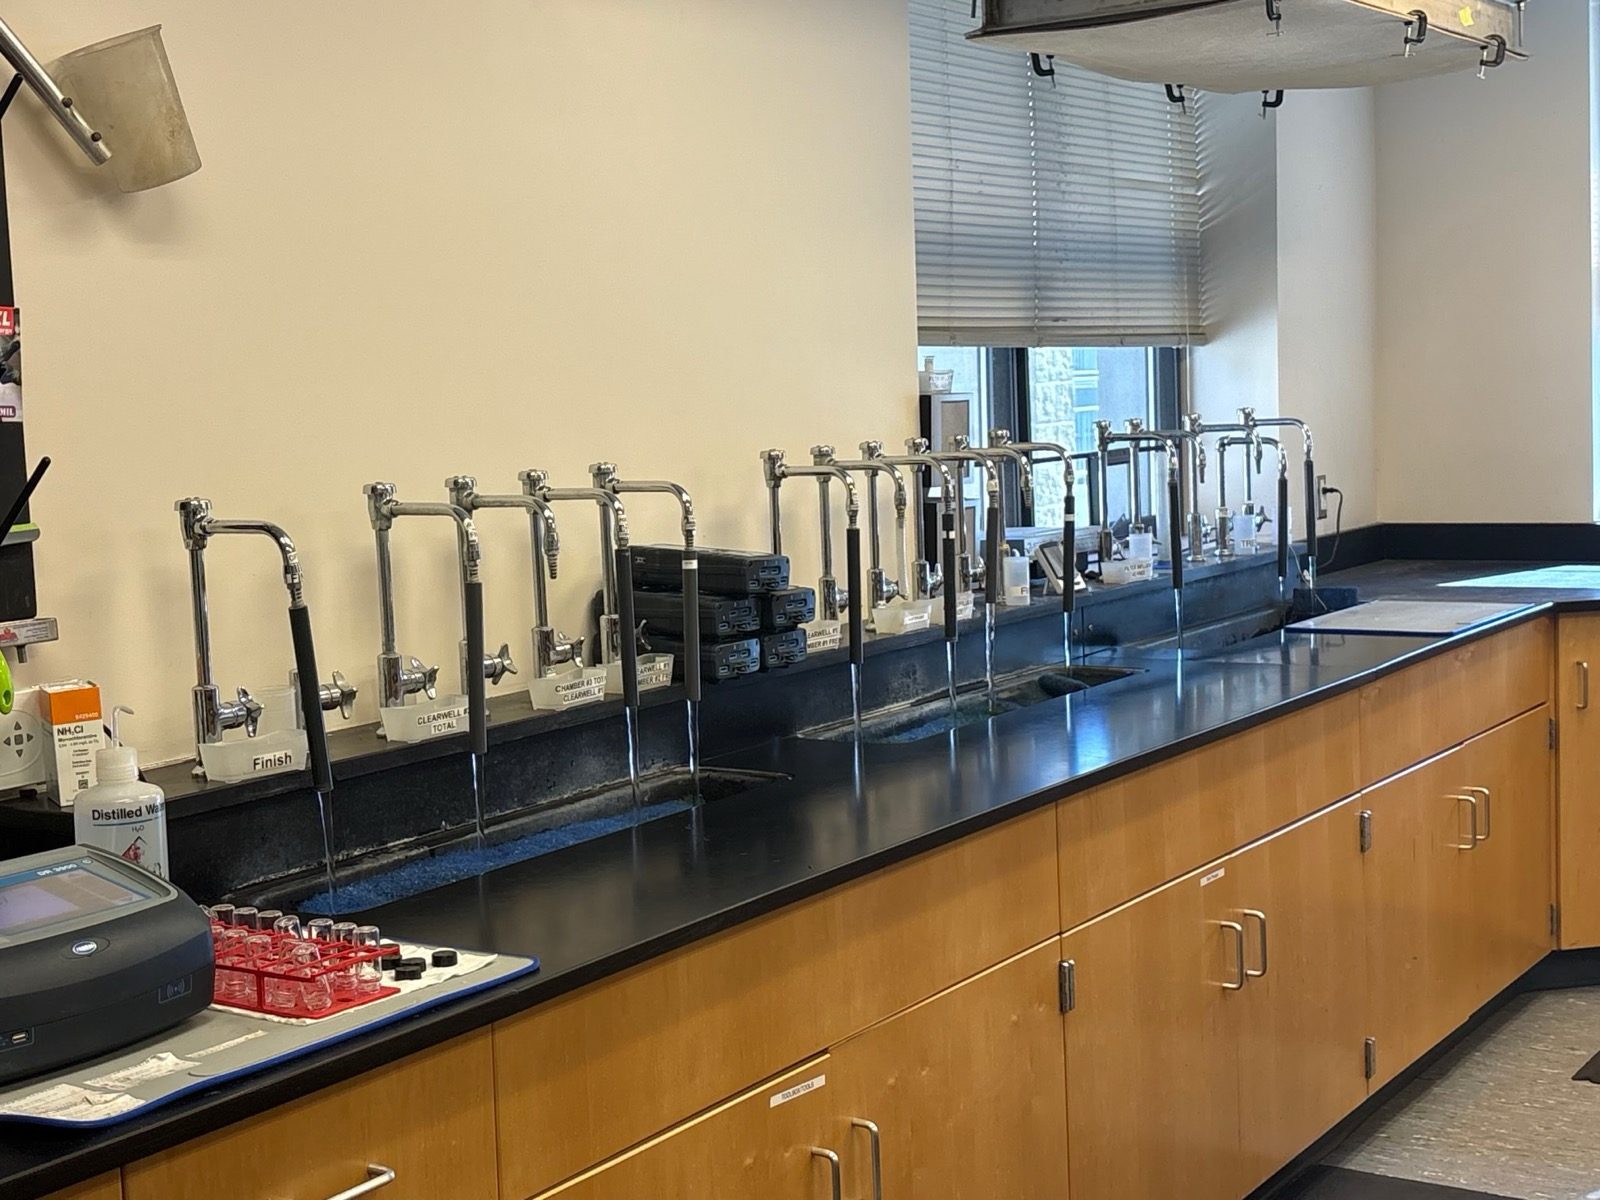
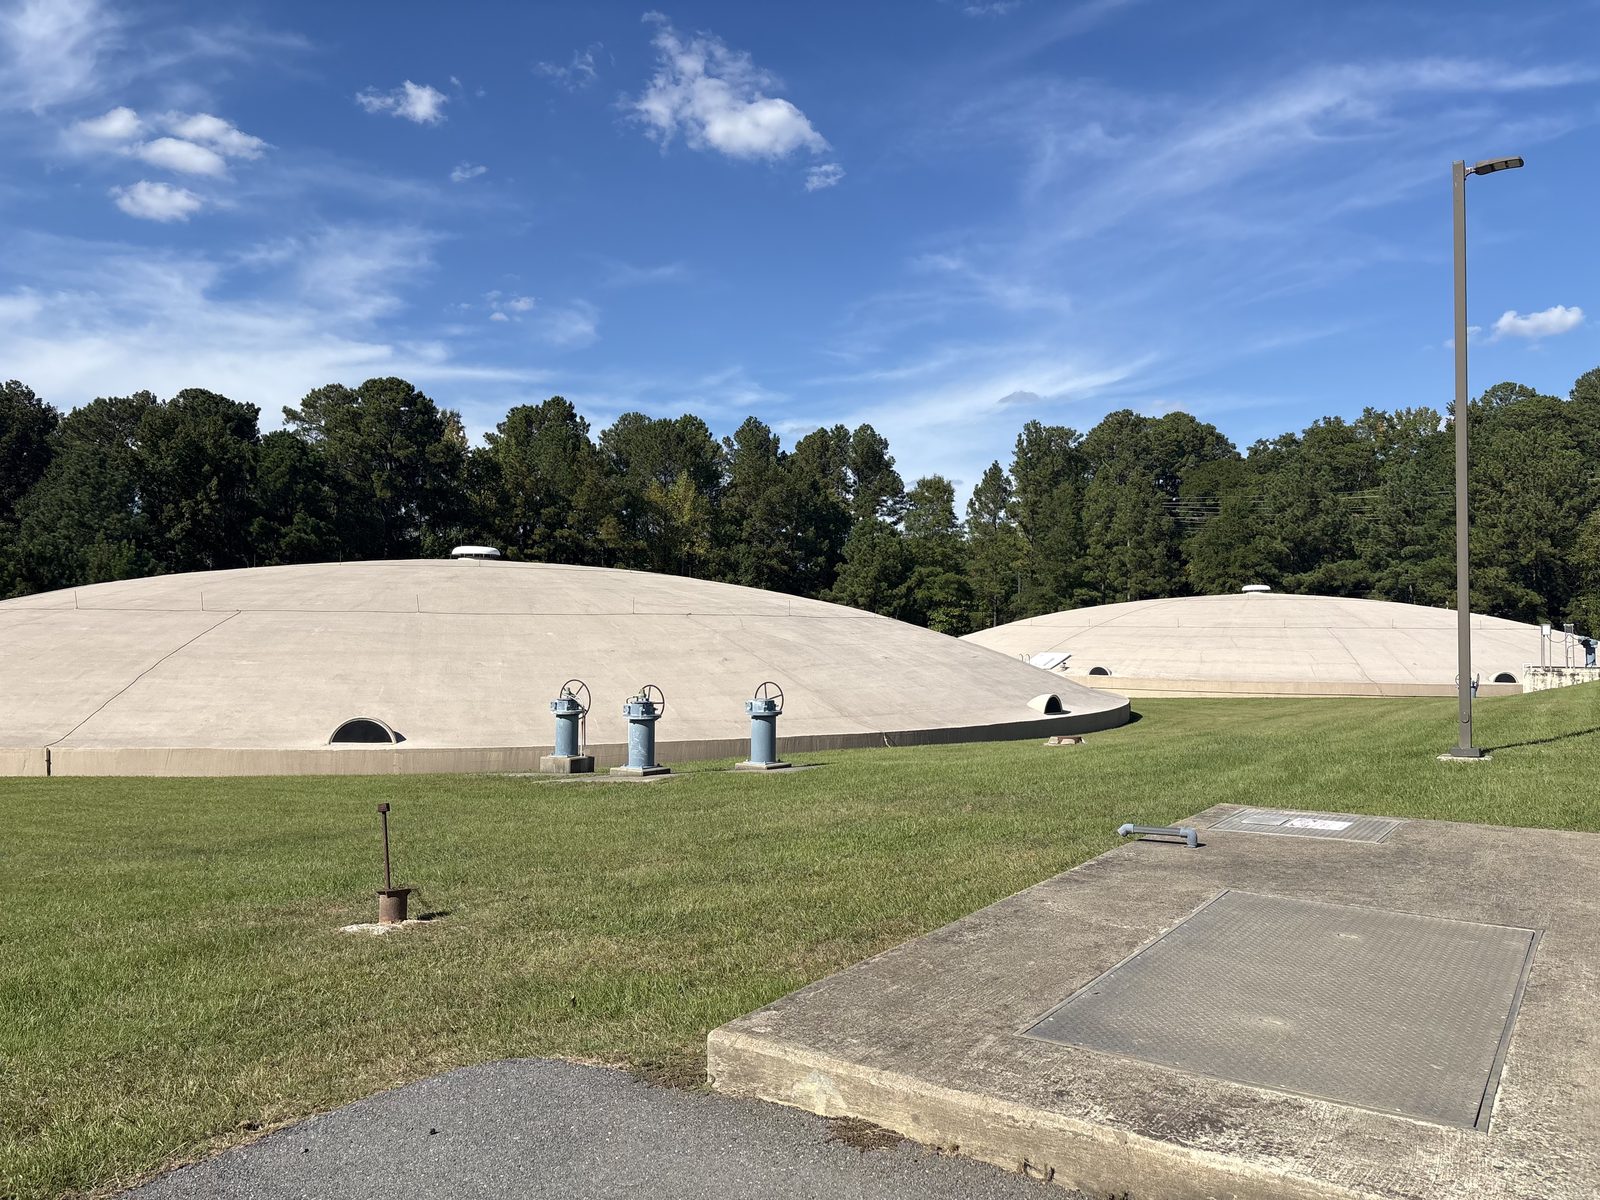
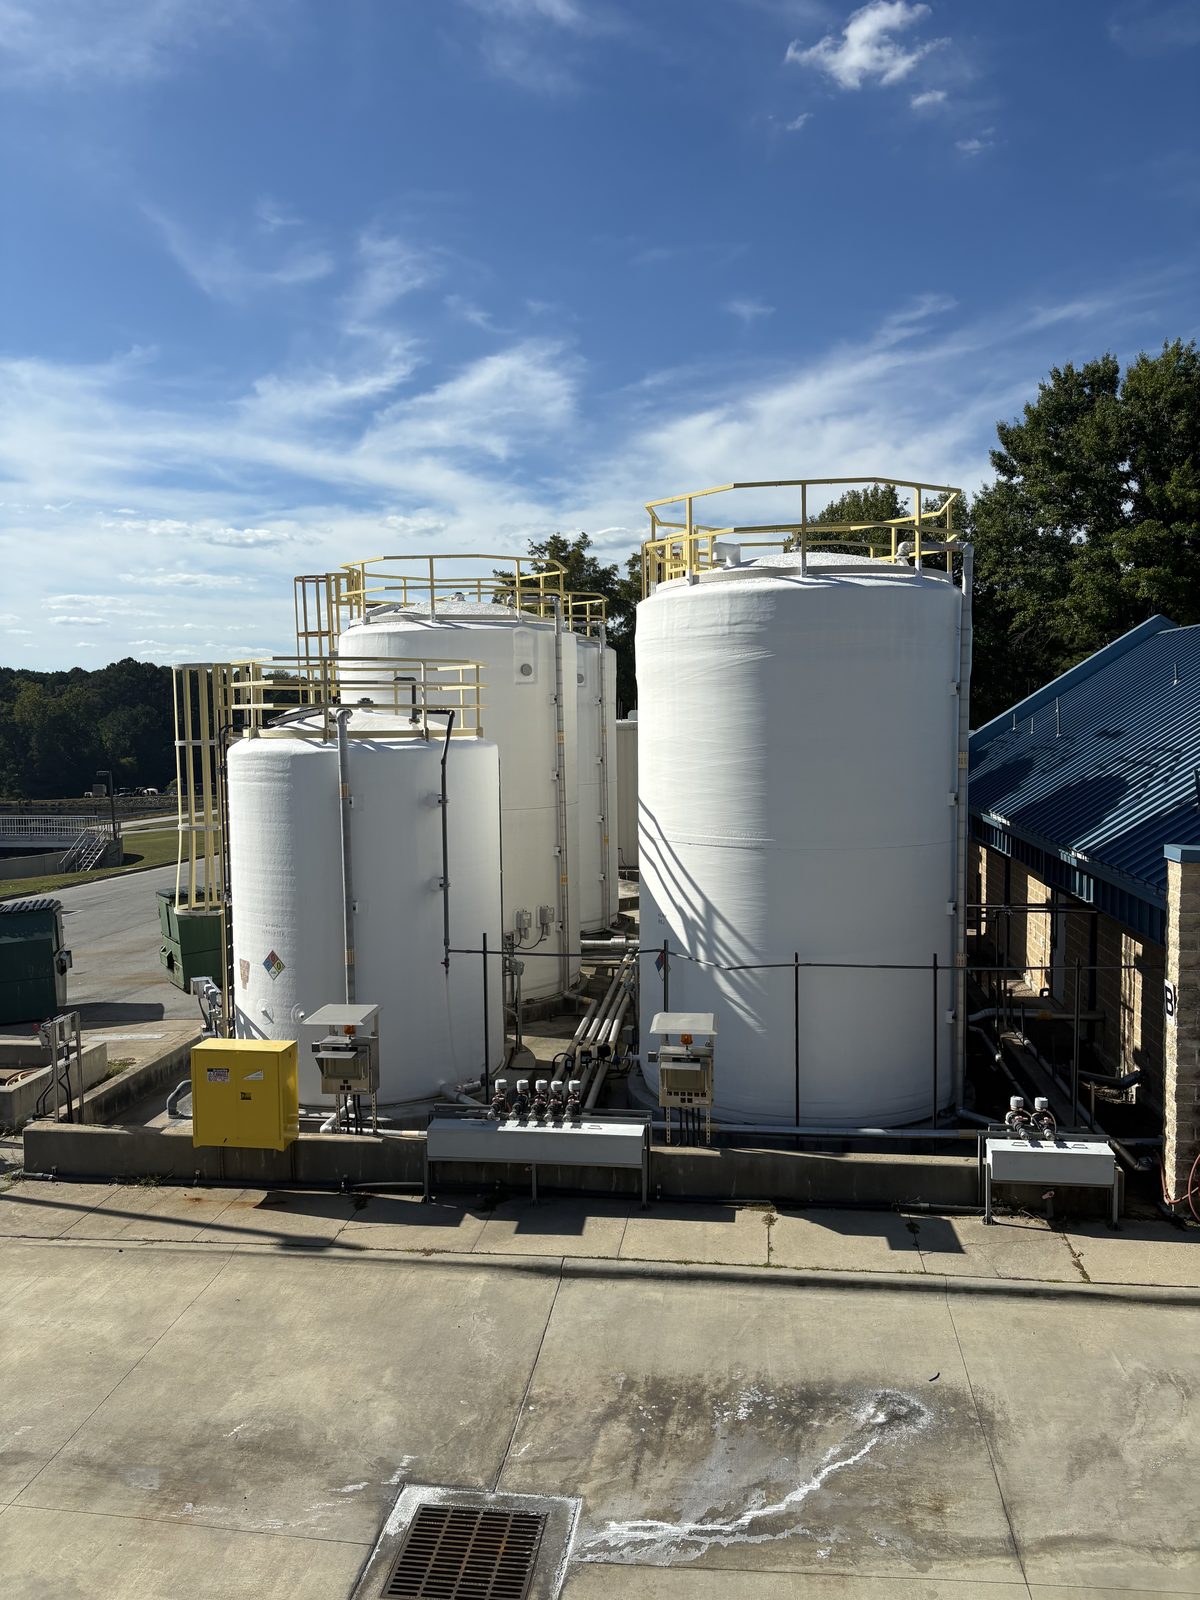
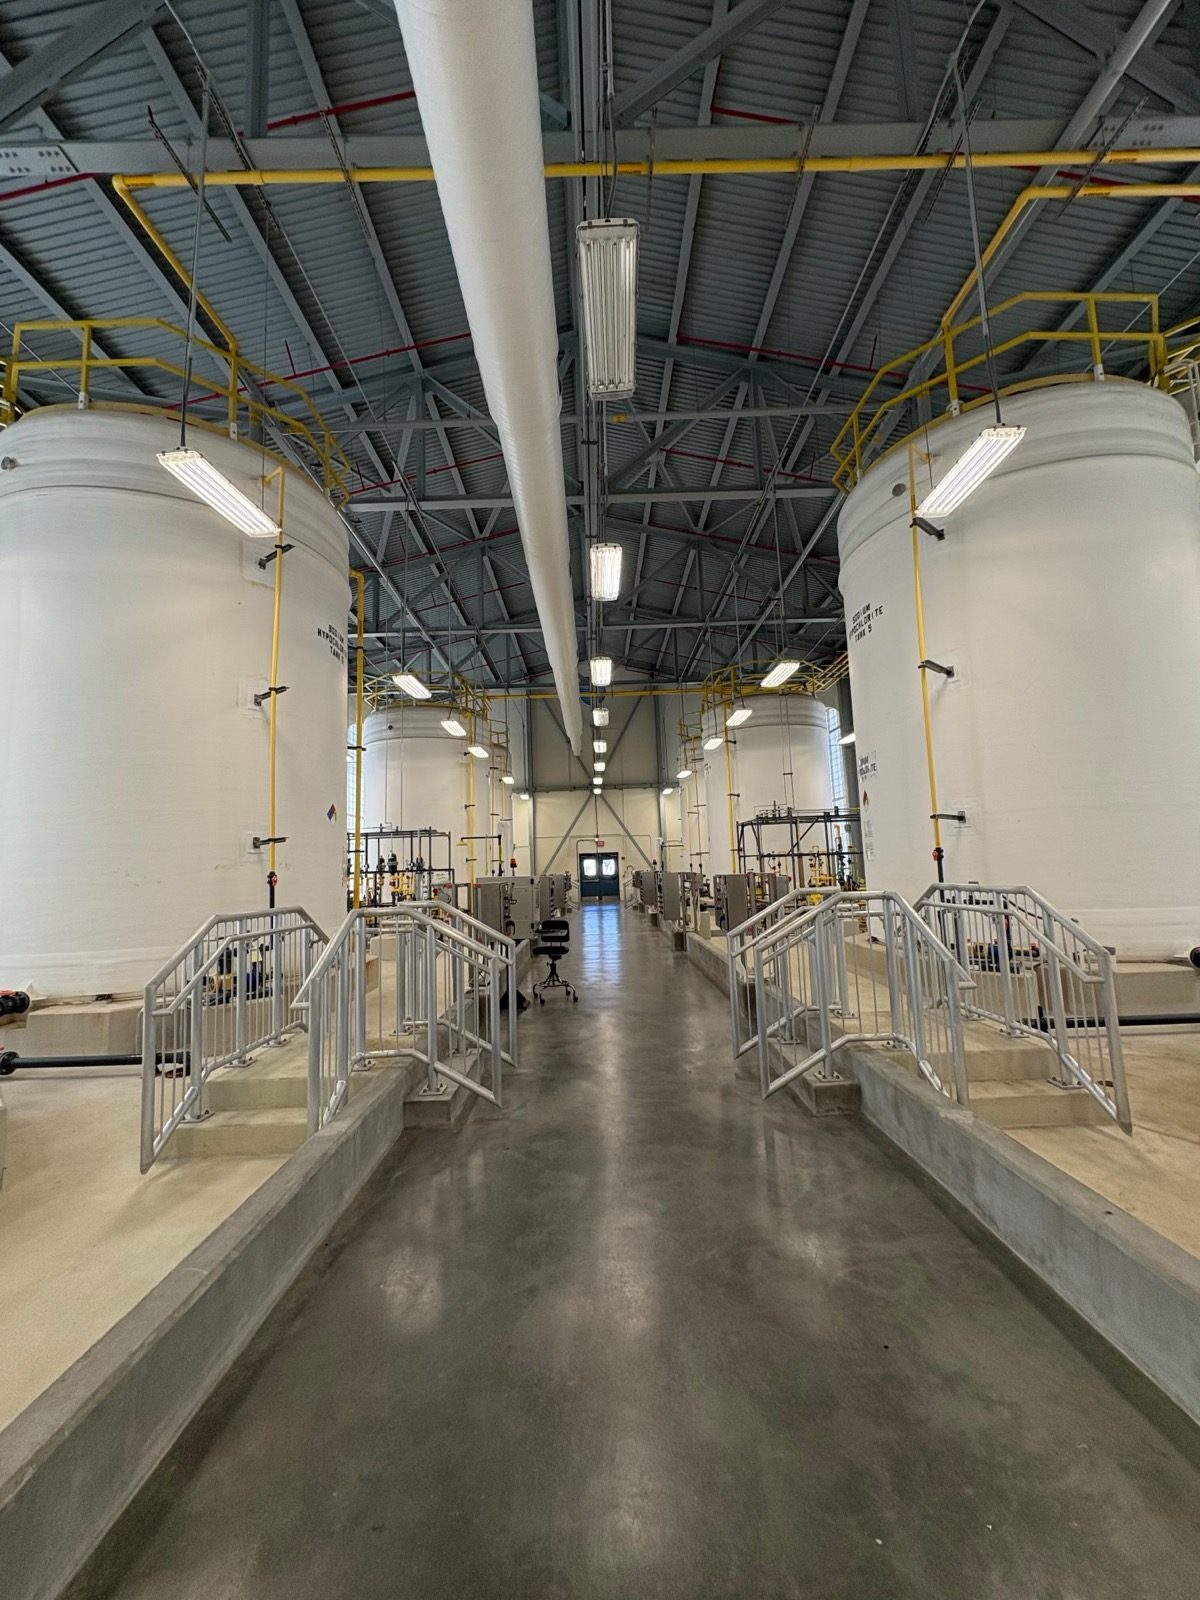
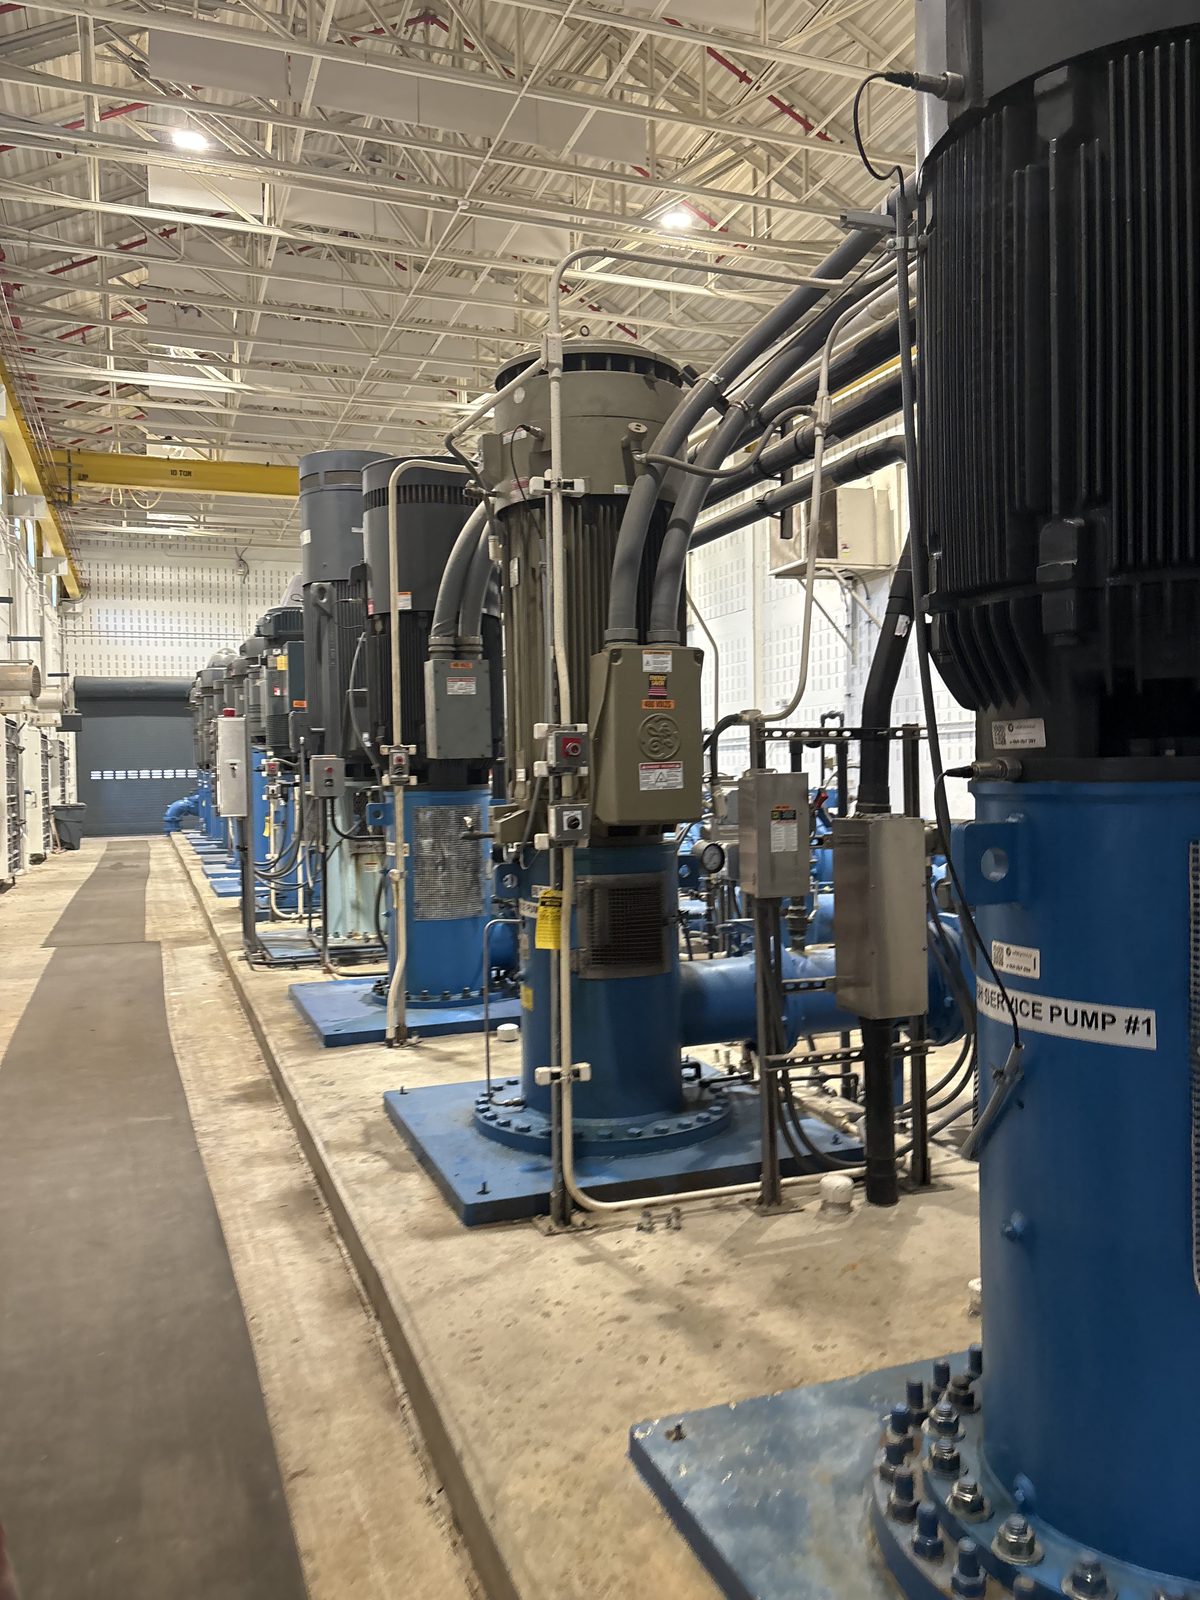
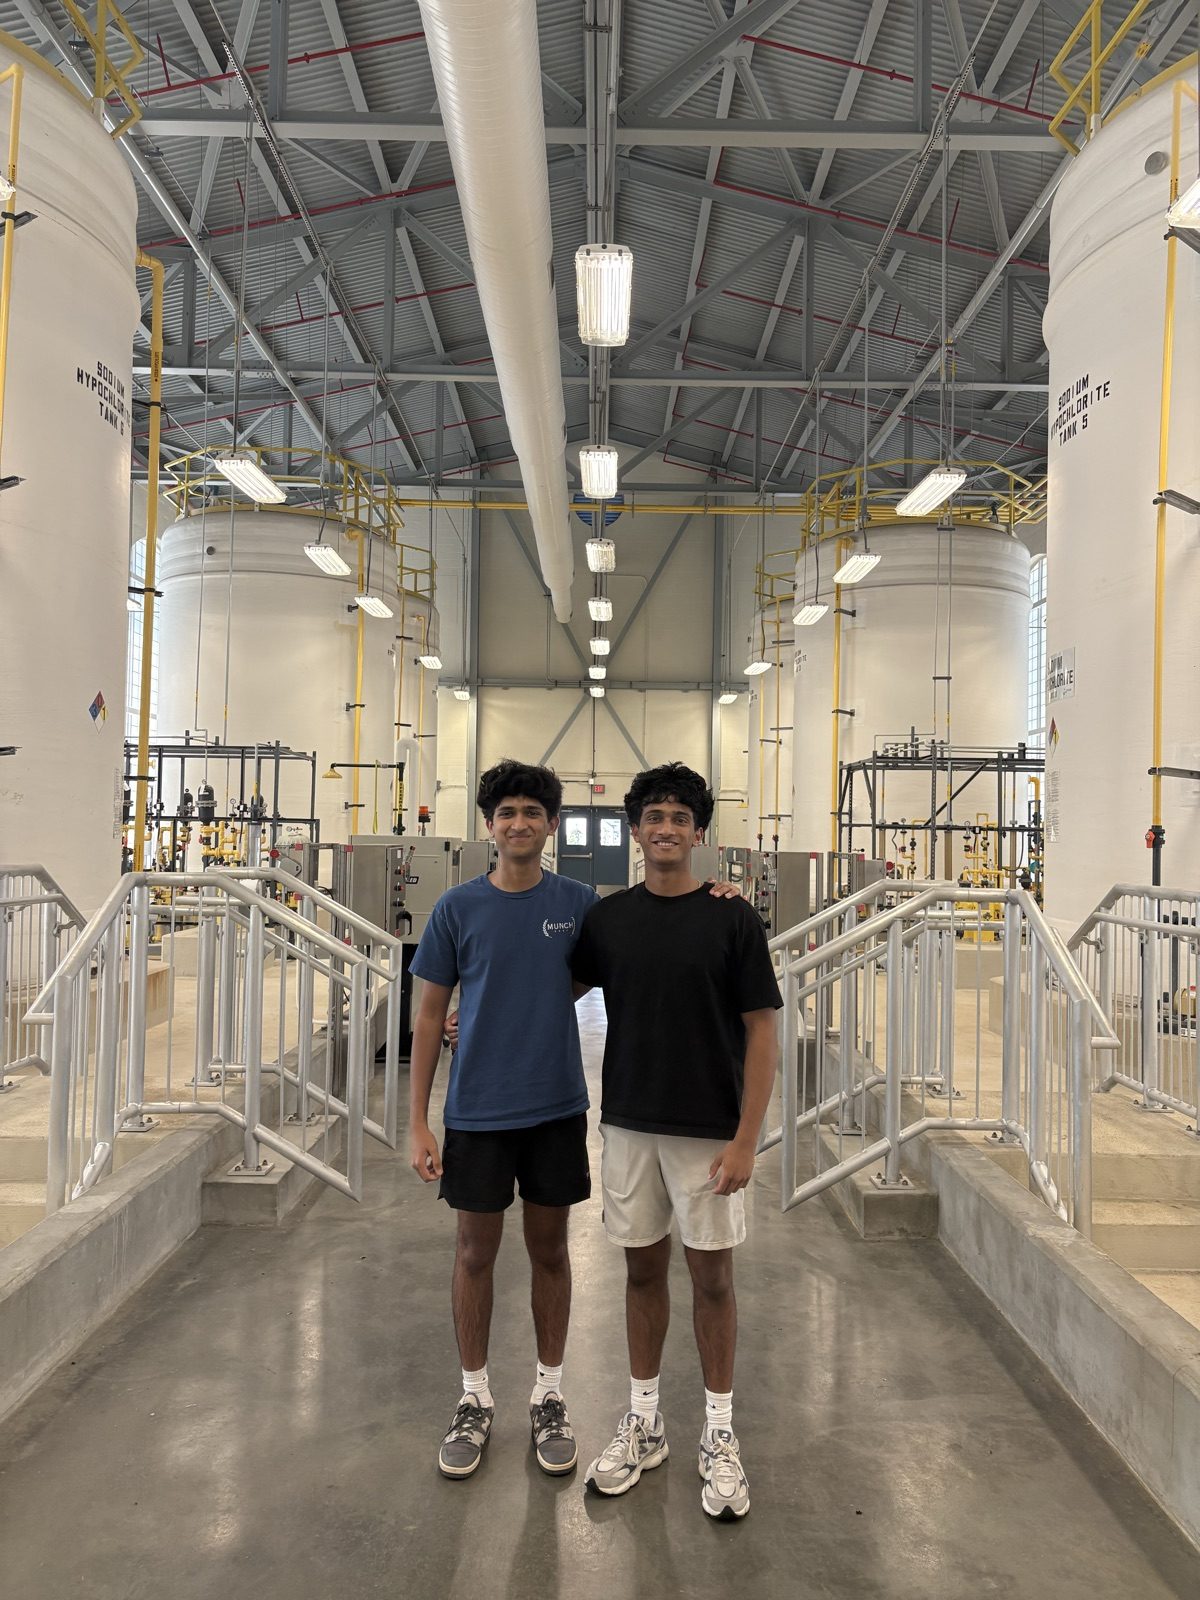
Settling basins, where clumped particles separate from the water.A microscope in the plant's laboratory.Analytical equipment in the state-certified laboratory, which runs about 100,000 tests a year.Sample taps in the lab. Each faucet is piped from a different stage of treatment, such as the filters, the clearwells, and the finished water leaving the plant, and runs nonstop so the sample is always fresh. Staff test each stream for things like turbidity, pH, and chlorine, which shows how much every step improved the water and lets operators adjust before it reaches homes.Covered storage tanks on the plant grounds.Chemical storage tanks used in the treatment process.Sodium hypochlorite tanks in the chemical building. This chlorine solution disinfects the water after filtration, and the plant later converts it to chloramine, which lasts longer in the pipes. The curbed concrete pads hold any spill.Large pumps that move water through the plant.Standby generators that keep the plant running during power outages.
Thank you to the facility's laboratory team for hosting us. Facility figures are from the Town of Cary's virtual tour.
About us
Two Green Level seniors from Cary.
We are Arjun Pendharkar and Siddharth Santhosh, seniors at Green Level High School who both live in the Cary area. We built this tool under the supervision of Dr. Bharati Pandi.
Why we did it
It started with a news story. In June 2022, ABC11 reported that dogs became ill after swimming at Jordan Lake, and at least one died, after toxic algae turned up in the water. That one hit close to home. Arjun's dog, Oreo, goes on regular walks near Jordan Lake, and it was easy to picture Oreo being one of those dogs. We wanted to know how a bloom like that gets treated, and whether the treatment itself could hurt the rest of the lake. The question turned out to be the perfect mix of biology and technology, which let us combine both of our specialties: the ecology and toxicology behind each score, and the code that turns published data into a ranking anyone can run.
Arjun and Siddharth at the Cary/Apex Water Treatment Facility, September 2026.
Contact
What's next and how to reach us
What's next
The predictions are the easy part. Testing them is the work.
The framework is complete. Everything below is what turns it from a set of predictions into validated findings.
1
Validation
Test the rankings in a lab
Planned
Three treatments that can be sourced as pure compounds and dosed precisely: copper sulfate, hydrogen peroxide, and diquat dibromide. Three organisms: Microcystis aeruginosa as the target, Raphidocelis subcapitata as the green alga, and Daphnia magna as the grazer.
3treatments
3organisms
~360test units
Each treatment and each predicted pair will be tested across a five-point dose series plus a control, following OECD 201 for the algae and OECD 202 for Daphnia. That comes to roughly 360 individual test units.
The rule that makes it worth doing: every organism is measured at the same exposure time using the same endpoint. Much of the published literature does not do this, and mismatched exposure times are one of the reasons reported selectivity can be inflated. Generating matched data is the point.
Question 01
Does the measured ranking match the predicted ranking?
Question 02
Does each combination beat, match, or fall short of its Bliss prediction? Beating it means real synergy. Matching it means the framework is calibrated. Falling short means antagonism.
All three outcomes are reportable. The experiment is designed so that it cannot be failed, only answered.
2
Data
Fill in the missing data
Only 13 of 52 target-kill cells are currently filled. Some of those gaps are genuine absences in the literature, and some are values locked behind paywalls or buried in regulatory documents. Every cell filled makes the ranking more stable. Priorities are additional target-kill values for the three under-covered cyanobacteria genera, and cross-validating the values that currently rest on a single source.
3
Outreach
Put it in front of practitioners
A tool that only makes sense to its authors is not useful. We have begun reaching out to watershed and riverkeeper organizations, state water quality agencies, and university researchers working on cyanobacterial blooms, to find out whether the framework reflects how treatment decisions actually get made in the field.
The most useful response so far has been expert review of the data and wording, which led to the September 2026 diquat correction and to several of the limitations listed above.
4
Scope
Extend what it can score
Longer term, three directions. Extend the ranking to the other three target genera once the data supports it. Add treatments beyond the current thirteen, including compounds that are promising but not commercially available. And test whether the Bliss assumption holds across mechanisms, since agents that share a mode of action are the most likely to break it.
Reach out
Tell us where this is wrong.
We would rather hear that the framework misses something than have it sit unexamined. If any of the following applies to you, we would genuinely like to hear from you.
You manage a waterbody
Does this reflect how treatment decisions actually get made, or is it missing a constraint that matters in practice?
You have data that contradicts the rankings
That is the most useful thing anyone could send us. Measurements beat predictions.
You work on cyanobacteria or aquatic toxicology
We are particularly interested in target-kill values we have not found, and in where the assumptions break down.
You want to use it
It is free and MIT licensed. Tell us what would make it more usable.
Do you treat ponds or manage lakes?
Send us a quick email. Tell us which constraints, products, or field realities the ranking leaves out.